Rapid Ejection (Phase 3)
Aortic and Pulmonic Valves Open; AV Valves Remain Closed
 This phase represents initial, rapid ejection of blood into the aorta and pulmonary arteries from the left and right ventricles, respectively. Ejection begins when the intraventricular pressures exceed the pressures within the aorta and pulmonary artery, which causes the aortic and pulmonic valves to open. Blood is ejected because the total energy of the blood within the ventricle exceeds the total energy of blood within the aorta. In other words, there is an energy gradient to propel blood into the aorta and pulmonary artery from their respective ventricles. During this phase, ventricular pressure normally exceeds outflow tract pressure by a few mmHg. This pressure gradient across the valve is ordinarily low because of the relatively large valve opening (i.e., low resistance). Maximal outflow velocity is reached early in the ejection phase, and maximal (systolic) aortic and pulmonary artery pressures are achieved.

- No heart sounds are ordinarily noted during ejection because the opening of healthy valves is silent. The presence of sounds during ejection (i.e., systolic murmurs) indicate valve disease or intracardiac shunts.
- Left atrial pressure initially decreases as the atrial base is pulled downward, expanding the atrial chamber. Blood continues to flow into the atria from their respective venous inflow tracts and the atrial pressures begin to rise. This rise in pressure continues until the AV valves open at the end of phase 5.
- Phase 1 - Atrial Contraction
- Phase 2 - Isovolumetric Contraction
- Phase 3 - Rapid Ejection
- Phase 4 - Reduced Ejection
- Phase 5 - Isovolumetric Relaxation
- Phase 6 - Rapid Filling
- Phase 7 - Reduced Filling
http://www.cvphysiology.com/Heart%20Disease/HD002a.htm
Pressure Changes
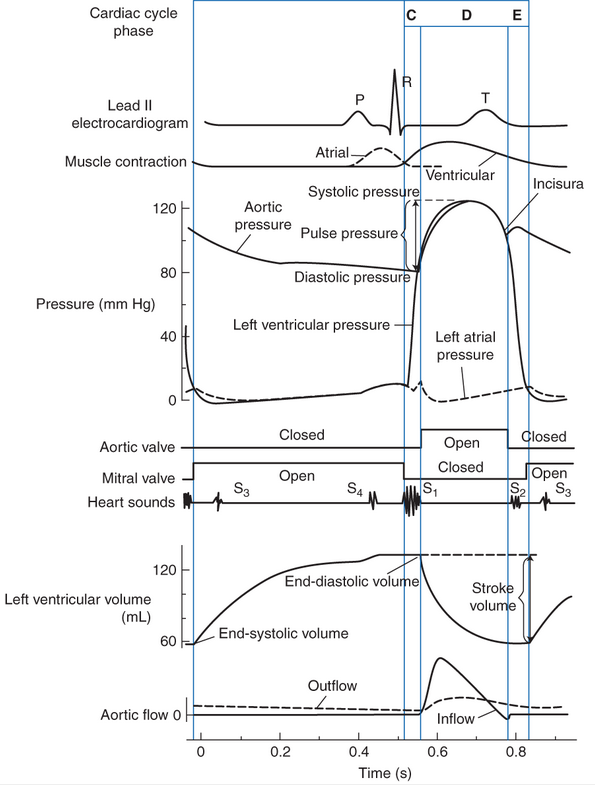
The cardiac cycle diagram shown to the right depicts changes in aortic pressure (AP), left ventricular pressure (LVP), left atrial pressure (LAP), left ventricular volume (LV Vol), and heart sounds during a single cycle of cardiac contraction and relaxation. These changes are related in time to the electrocardiogram. An online video and tutorial of the cardiac cycle from the Health Education Assets Library is available: cardiac cycle video.
Aortic pressure is measured by inserting a pressure-measuring catheter into the aorta from a peripheral artery, and the left ventricular pressure is obtained by placing a catheter inside the left ventricle and measuring changes in intraventricular pressure as the heart beats. Left atrial pressure is not usually measured directly, except in investigational procedures; however, left atrial pressure can be estimated by recording the pulmonary capillary wedge pressure. Ventricular volume changes can be assessed in real time using echocardiography or radionuclide imaging, or by using a special volume conductance catheter placed within the ventricle.
- Stroke Volume
- Diastolic Filling: Starling’s Law of the Heart
- Autonomic Neural Influences
- Requirements for Effective Ventricular Pumping
- Myocardial Oxygen Supply and Demand
1. Pre-Load - degree of stretch of cardiac muscle (venricle) before they contract is the critical factor controlling stroke volume (Frank-Starling Law od the Heart)
2. Contractility - cardiac cell contractile force due to factors other than EDV
3. Afterload - back pressure exerted by blood in the large aerteries leaving the heart
4. Slow heartbeat and exercise increase venous return to the heart, increasing stroke volume
5. Blood loss and extremely rapid heartbeat decrease stroke volume
Historical Perspective
One of the most fundamental causes of variations in stroke volume was described by William Howell in 1884 and by Otto Frank in 1894 and formally stated by E. H. Starling in 1918. These investigators demonstrated that, with other factors being equal, if cardiac filling increases during diastole, the volume ejected during systole also increases. As a consequence, stroke volume increases nearly in proportion to increases in end-diastolic volume. This phenomenon is commonly referred to as Starling’s law of the heart.

Starling’s law of the heart.
Starling’s law is a direct consequence of the intrinsic mechanical properties of cardiac muscle cells. The primary consequence is that stroke volume (and therefore cardiac output) is strongly influenced by cardiac filling during diastole. Factors that affect cardiac filling affect the regulation of cardiac output.
Cardiac function is influenced by neural inputs from both the sympathetic and parasympathetic divisions of the autonomic nervous system. These inputs allowmodifification of cardiac pumping as is appropriate to meet changing homeostatic needs of the body.
All portions of the heart are richly innervated by adrenergic sympathetic fibers. When active, these sympathetic nerves release norepinephrine ( noradrenaline) on cardiac cells. Norepinephrine interacts with β1-adrenergic receptors on cardiac muscle cells to increase the heart rate, increase the action potential conduction velocity, and increase the force of contraction and rates of contraction and relaxation. Overall, sympathetic activation acts to increase cardiac pumping.
Cholinergic parasympathetic nerve fibers travel to the heart via the vagus nerve and innervate the SA node, the AV node, and the atrial muscle. When active, these parasympathetic nerves release acetylcholine on cardiac muscle cells. Acetylcholine interacts with muscarinic receptors on cardiac muscle cells to decrease the heart rate (SA node) and decrease the action potential conduction velocity (AV node). Parasympathetic nerves may also act to decrease the force of contraction of atrial (not ventricular) muscle cells. Overall, parasympathetic activation acts to decrease cardiac pumping. Usually, an increase in parasympathetic nerve activity is accompanied by a decrease in sympathetic nerve activity, and vice versa.
-
The contractions of individual cardiac muscle cells must occur at regular intervals and be synchronized (not arrhythmic).
-
The valves must open fully (not stenotic).
-
The valves must not leak (not insufficient or regurgitant).
-
The muscle contractions must be forceful (not failing).
-
The ventricles must fill adequately during diastole.
 Factors determining myocardial oxygen supply and demand.
Extraction of O2 from arterial blood is maximal at rest. As demand increases (with exercise or hemodynamic stress), the oxygen supply to the myocardium must also increase. Oxygen supply is determined by the oxygen content of arterial blood and by coronary blood flow.
The oxygen content of blood is dependent on hemoglobin-bound oxygen and, to a lesser extent, dissolved oxygen. Although a high hemoglobin level gives the blood high oxygen-carrying capacity, the minimum level of hemoglobin necessary to avoid ischemia has not been well defined in clinical studies. Factors that affect this limit include the severity of coronary artery disease, the heart rate, perfusion pressure, and myocardial wall thickness and tension. Furthermore, actual delivery of oxygen to myocardial tissue is dependent on release of oxygen from hemoglobin according to the oxyhemoglobin dissociation curve. A leftward shift of this curve caused by alkalosis, hypothermia, or low levels of 2,3,-diphosphoglycerate (which may be observed after the transfusion of a large volume of stored autologous blood) will decrease the release of oxygen.
The duration of diastole is another important factor affecting oxygen supply to the myocardium because 70% to 80% of coronary arterial blood flow occurs during the diastolic phase of the cardiac cycle. During the systolic phase, cardiac contraction increases intraventricular cavitary pressure and coronary vascular resistance, thus impeding myocardial perfusion. There is a nonlinear relationship between heart rate and the duration of diastole.The total time per minute spent in diastole is a function of the heart rate. This is a major reason for the use of β-blockers as anti-ischemic agents both for long-term therapy and for preventing even small increases in heart rate during the perioperative period.
Determinants of blood flow in normal coronary arteries include the pressure differential across the coronary bed (coronary perfusion pressure) and coronary vascular resistance. The coronary perfusion pressure for the left ventricle is the aortic blood pressure during diastole minus left ventricular end-diastolic pressure (LVEDP); thus, elevations in LVEDP impede subendocardial blood flow. Because coronary stenosis causes vessels to dilate maximally distal to the stenosis, manipulation of coronary perfusion pressure becomes an important factor determining coronary blood flow (and preventing or treating myocardial ischemia). However, because the determinants of myocardial oxygen balance are complex, altering any one of them can produce multiple effects. For example, an increase in blood pressure increases coronary blood flow but also increases afterload, thereby increasing wall tension and oxygen demand.
In anesthetized patients undergoing anesthesia for coronary revascularization, vigilant monitoring for myocardial ischemia is necessary throughout the perioperative period.
Pulmonary artery (pressure and flow)
Pulmoinary vein (pressure and flow)
Coronary artery pressure and time of flow)
+++++++++++++++++++++++
Detailed Video of the Cardiac Cycle

Detailed descriptions of each phase can be obtained by clicking on each of the seven phases listed below.
- Phase 1 - Atrial Contraction
- Phase 2 - Isovolumetric Contraction
- Phase 3 - Rapid Ejection
- Phase 4 - Reduced Ejection
- Phase 5 - Isovolumetric Relaxation
- Phase 6 - Rapid Filling
- Phase 7 - Reduced Filling
http://www.cvphysiology.com/Heart%20Disease/HD002a.htm
Aortic pressure is measured by inserting a pressure-measuring catheter into the aorta from a peripheral artery, and the left ventricular pressure is obtained by placing a catheter inside the left ventricle and measuring changes in intraventricular pressure as the heart beats. Left atrial pressure is not usually measured directly, except in investigational procedures; however, left atrial pressure can be estimated by recording the pulmonary capillary wedge pressure. Ventricular volume changes can be assessed in real time using echocardiography or radionuclide imaging, or by using a special volume conductance catheter placed within the ventricle.
- Cardic Output & Stroke Volume
- Diastolic Filling: Starling’s Law of the Heart
- Autonomic Neural Influences
- Requirements for Effective Ventricular Pumping
- Myocardial Oxygen Supply and Demand
Volume of blood pumped by the heart each minute; approximately 3.5–5.5 L/min (adult). CO is standardized to patient size by calculation of the cardiac index (CI): CI = CO/BSA; normal CI ≈ 2.8–3.2 L/min/m2. CI < 2.5 L/min/m2 may require pharmacologic intervention if O2 delivery is inadequate.
CO is the product of heart rate and stroke volume.
Stroke volume is a function of preload, afterload, and contractility.
1. Pre-Load -
Initial length of myocardial muscle fibers is proportional to left ventricular end-diastolic volume (LVEDV), which is governed by the volume of blood remaining in the left ventricle after systole.
As LVEDV increases, the stretch on myocardial muscle fibers increases. Furthermore (Figure, top), as LVEDV increases (ie, stretch), the energy of contraction increases proportionally until an optimal tension develops (Starling law; Figure, middle). However, when the myocardial muscle fiber is overstretched, contractile strength decreases.
Representation of Starling law. PAOP = pulmonary artery occlusion pressure.
degree of stretch of cardiac muscle (venricle) before they contract is the critical factor controlling stroke volume (Frank-Starling Law od the Heart)
2. Contractility -
Cardiac cell contractile force due to factors other than EDV; Ability of heart to alter its contractile force and velocity independent of fiber length (ie, the intrinsic strength of the individual muscle fiber cells). Contractility may be increased by stimulation of beta-receptors in the heart (see following section).
3. Afterload
Resistance to ventricular ejection; measured clinically with aortic BP and calculation of systemic vascular resistance (SVR).
[4. Slow heartbeat and exercise increase venous return to the heart, increasing stroke volume
5. Blood loss and extremely rapid heartbeat decrease stroke volume]
Sympathetic Nervous System Influence on the Cardiovascular System
CO and its determinants (preload, afterload, and contractility) are influenced by the sympathetic nervous system (SNS). The SNS releases catecholamines (predominantly epinephrine and norepinephrine), which bind to end-organ receptors and exert a physiologic response.
Adrenergic receptors are divided into two major classes: alpha (α) and beta (β). Summary End-organ function after receptor activation.
Adrenergic Receptors and Their Actions on the Cardiovascular System
Receptor Location Action Alpha (α)1 Peripheral arterioles Vasoconstriction (increased SVR) Beta (β)1 Myocardium Increased contractility SA node Increased heart rate Beta (β)2 Peripheral arterioles Vasodilatation (decreased SVR) Bronchiolar smooth muscle Bronchodilatation Relative Actions of Sympathomimetic Drugs on Adrenergic Receptors
Effect On Drug α β1 β2 D Phenylephrine ++++ 0 0 Norepinephrine ++++ ++ 0 Epinephrine ++++ ++++ ++ Dobutamine + ++++ ++ Isoproterenol 0 ++++ +++ Dopamine (mcg/kg/min) 10–20 5–10 1–5
